
Open-Source Tools to monitor Kubernetes Cluster
Orchestration and Distributed Computing have solved many software problems by autoscaling, zero downtime, etc. It is working like a revolution in IT Industry. But it also has created new challenges. To the end-user Kubernetes Cluster appears like a single computer but it is actually a set of independent nodes and multiple services that have been connected. To monitor these nodes and services your monitoring and observability strategy should be changed, and so will the tools you use. Here are some most popular Open-Source monitoring tools which you can choose while working on Kubernetes Cluster.
1. Kubelet
Kubelet is a primary node agent that runs on each nodes and maintains set of pods. It acts like a bridge between master and the nodes in Kubernetes cluster. It watches for PodSpecs via the Kubernetes API server and collects resource utilization statistics and pod and events status.
Kubelet fetches individual container usage metrics from Docker’s Container Advisor (cAdvisor). But it also accepts PodSpecs provided through different mechanisms and ensures that the containers described in those PodSpecs are up and running. These aggregated pod resource usage statistics are exposed via a REST API.
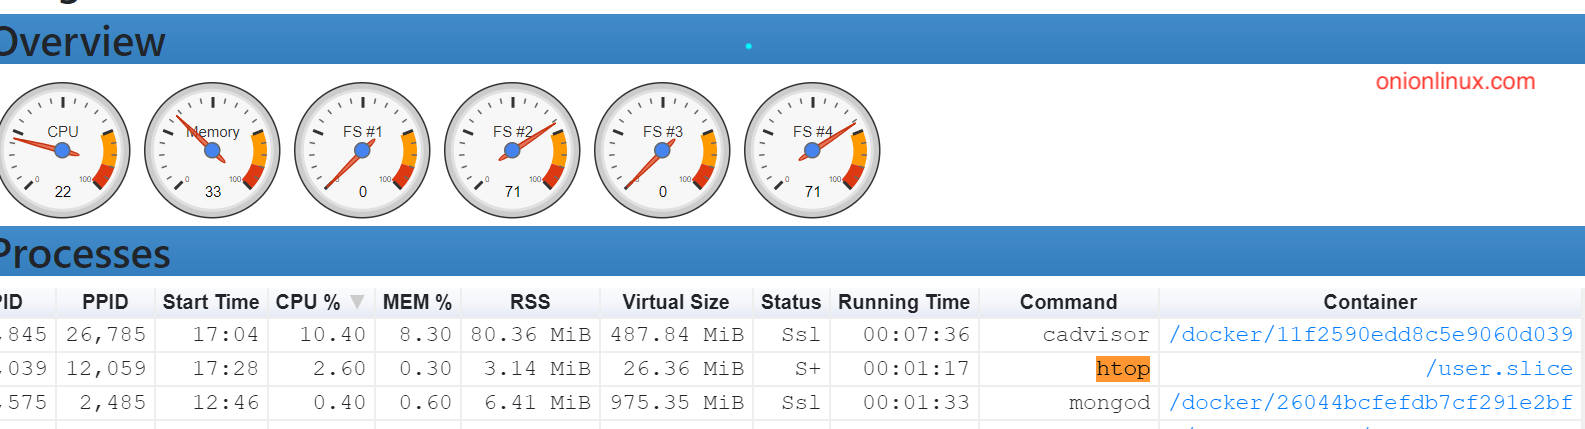
2. Container Advisor(cAdvisor)
Container Advisor generally known as cAdvisor, gives you insight and understanding into the resource usage and performance characteristics of running containers. It is a running daemon that collects, aggregates, processes, and exports information about running containers. It discovers all containers in the machine and collects metrics. cAdvisor has native support for Docker Container.
Pros:
- cAdvisor is an open-source container resource usage collector.
- Exposes raw and processed stats via a versioned remote REST API
- cAdvisor operates per node. It auto-discovers all containers in the given node and collects CPU, memory, filesystem, and network usage statistics.
- Native support for Docker containers with support for other container types.
- It supports exporting stats to various storage plugins like Elasticsearch, InfluxDB, etc.
Cons:
- Collects only basic resource utilization, so it is feasible for basic metrics monitoring
- It doesn’t offer any long-term storage, trending, or analysis capabilities.
- It captures only metrics, not logs, traces, or events
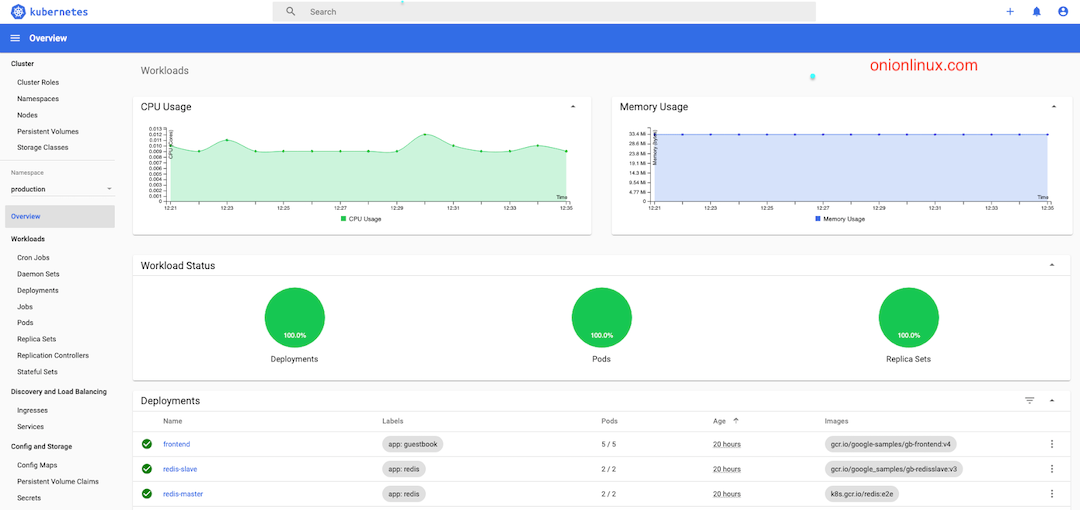
3. Kubernetes Dashboard
Kubernetes-Dashboard is a web-based UI and add-on for Kubernetes Cluster. It has many features which provide a simple way to manage, troubleshoot, and monitor your environment. It also allows users to create and manage workloads as well as do discovery, load balancing, configuration, storage, and monitoring. You can use Kubernetes Dashboard to view basic CPU and memory usage metrics aggregated across all nodes. It can also be used to monitor the health status of workloads (pods, deployments, replica sets, cron jobs, etc.). Installation can be done using ready-to-use YAML files.
Pros:
- Easy to install
- Comes as an add-on to Kubernetes Cluster
- Part of Kubernetes ecosystem
Cons:
- It has very limited features
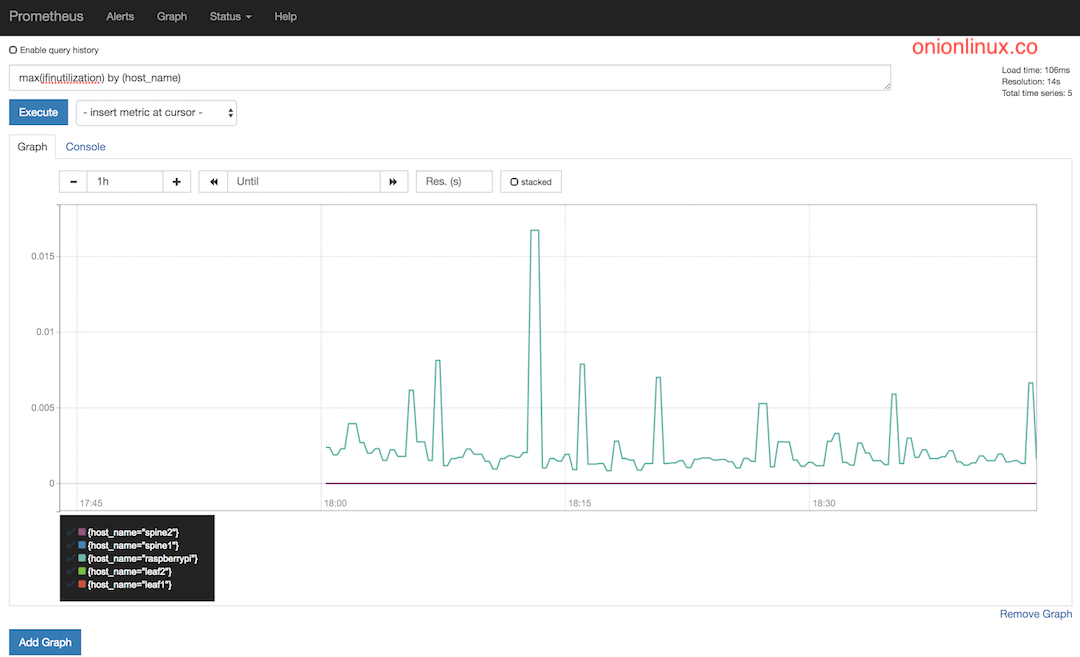
4. Prometheus
Prometheus is one of the most popular open-source tool used to monitor the Kubernetes clusters. It’s community-driven and a member of the Cloud Native Computing Foundation. Initially, it is developed by SoundCloud and afterward donated to the CNCF, is inspired by Google Borg Monitor.
It stores all its data as a time series, it has a simple yet powerful multidimensional data model and its flexible query language (PromQL). it follows a pull model rather than push and has built-in real-time alerting mechanisms.
Prometheus has no built-in dashboard, so you’ll need to use a separate visualization tool. generally, we use Grafana to visualize Prometheus metrics.
installation can be easily done on top of Kubernetes Cluster using Prometheus-operator.
Pros:
- Built-in for both Monitoring and Alerting
- Kubernetes-native, easy to use
- Functional and reliable even during the outages
- It has a large community
- Integration with Grafana is too easy
Cons:
- Not good for long-term storage
- No dashboard
- Doesn’t handle logs or traces, only metrics
- No anomaly detection
- No authentication/authorization
5. Kubewatch
Kubewatch is a Kubernetes watcher which that publishes notifications to available notification channels. It is written in Golang and uses a Kubernetes client library to interact with a Kubernetes API server. You just have to run it in your Kubernetes cluster, and get event notifications through webhooks.
You can choose the resources to watch, including daemon sets, deployments, pods, replica sets, replication controllers, services, secrets, and configuration maps using a simple YAML file.
Once the Kubewatch pod is up and running, you will start seeing Kubernetes events in your configured Slack channel or any other webhook you configured.
Pros:
- Very simple to setup
- Instant notifications to the preferred location
Cons:
- It doesn’t offer any long-term storage, trending, or analysis capabilities.
- Useful only for basic events
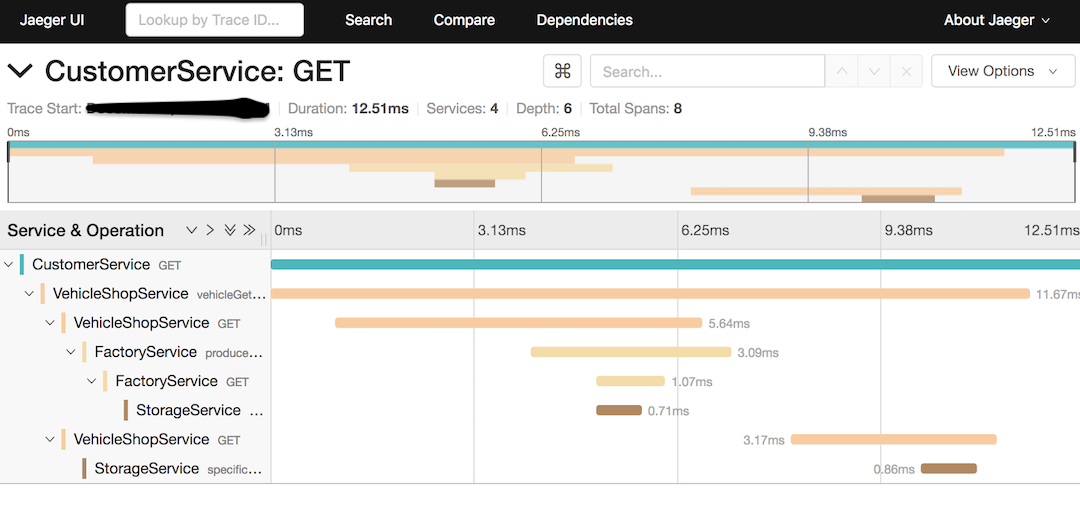
6. Jaeger
Jaeger is an open-source tool launched by Uber Technologies. It is a free tracing tool used for monitoring and troubleshooting in complex distributed systems, including Kubernetes environments.
Jaeger helps users to perform root cause analysis, distributed transaction monitoring, distributed context propagations, service dependency analysis, and performance and latency optimization. Jaeger has native support for OpenTracing and addresses two main areas: networking and observability.
Jaeger facilitates OpenTelemetry-based support for Java, Node, Python, Go, and C++ and for various data sources, including Cassandra, Elasticsearch, Kafka, and memory.
Jaeger is easy to deploy, to deploy Jaeger, you can use Jaeger Operator or a DaemonSet configuration.
Pros:
- Easy to deploy
- Modern user interface
- It supports various instrumentation options
Cons:
- It supports very limited backend integration
7. Kube-state-metrics
Kube-state-metrics listen to the Kubernetes API server and generates metrics about the state of numerous Kubernetes objects, including cron jobs, config maps, pods, and nodes. Kubernetes API server exposes metrics about the count, health, and availability of pods, nodes, and other Kubernetes objects. These metrics are unmodified, unlike kubectl metrics that use the same Kubernetes API but apply some heuristics to display comprehensible and readable messages.
It uses the Golang Prometheus client to export metrics in the Prometheus metrics exposition format and expose metrics on an HTTP endpoint. These metrics can be easily consumed by any monitoring system that can collect Prometheus metrics.
Pros:
- It is simple to setup
- Compatible with Prometheus
Cons:
- It doesn’t offer any long-term storage, trending, or analysis capabilities.
- It only watches basic Kubernetes API metrics.
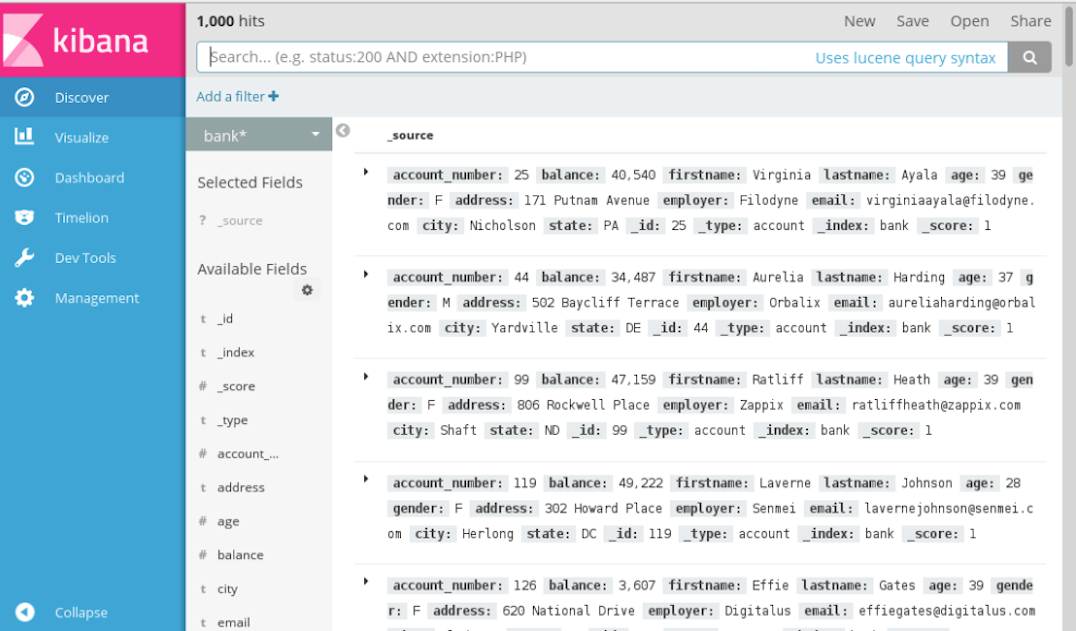
8. ELK Stack
ELK stack comprises Elasticsearch, Logstash and Kibana.
ELK is among the most popular open-source log management solutions, including for Kubernetes. ELK is basically a collection of four tools that ensures an end-to-end logging pipeline.
- Elasticsearch is a full-text search and analytics engine where you can store Kubernetes logs.
- Logstash is a log aggregator that captures and processes logs before shipping them to Elasticsearch.
- Kibana provides reporting and visualization functionalities.
- Beats are lightweight data shippers used to send logs and metrics to Elasticsearch.
ELK comes equipped with Kubernetes and Docker monitoring beats with auto-discovery. The Beats collect Kubernetes and Docker logs, metrics, and metadata, thus helping you monitor performance at the application and system level.
Pros:
- A large community works with ELK
- Rich analytics capabilities
- Easy to deploy and run in Kubernetes environment
Cons:
- Operating at scale requires a lot of expertise
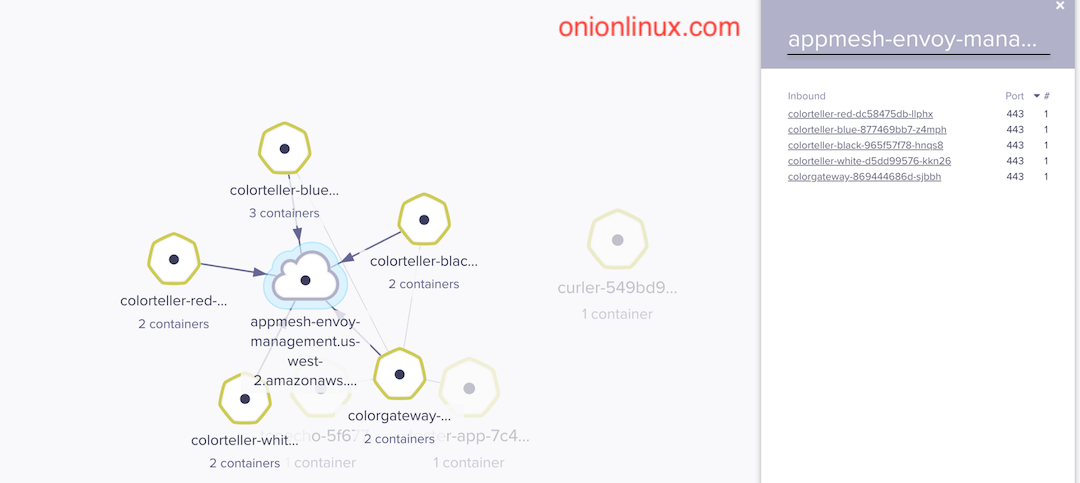
9. Weave Scope
Weave Scope is developed by Weaveworks, It is a zero-configuration tool that generates a map of processes, containers, and hosts in a Kubernetes cluster to help understand Docker containers in real-time. It can also be used to manage containers and run diagnostic commands on containers without leaving the graphical UI.
This tool can be extensible via some plugins. If you are looking for a graphical tool to obtain a visual overview of your Kubernetes cluster including the application, the infrastructure, and the connections among your cluster nodes—Weave Scope can solve your problem.
Choosing the right tool is important for successful monitoring and healthy systems. Some of the tools described above let you do more than just monitoring, including managing, troubleshooting and tracing.
You can read my other blog how-to-setup-kubernetes-cluster-in-local
I hope you like this post, if you have any questions? please leave a comment below!
Thanks for reading. If you like this post probably you might like my next ones, so please support me by subscribing to my blog.